Sketching Parabolas
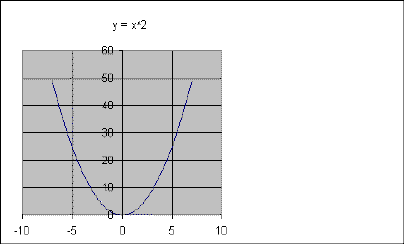
When graphing a parabola, it is not always necessary to graph them exactly. If you do not need exact coordinates, you can sketch parabolas. The basic parabola, y = x2, looks like this (left):


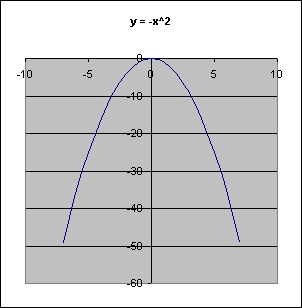
In the left graph, the value of a = 1, b = 0, and c = 0. The vertex is at (0,0) and the parabola opens upward. First, look at the value of a. If it is negative, the parabola looks like the one on the right.
If the value of a is made larger or smaller (as in made 5 or 0.5), the parabola also changes. Left: a is larger, Right: a is smaller.
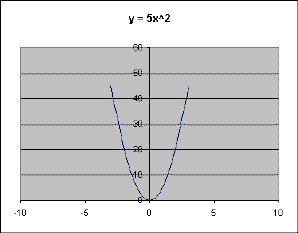
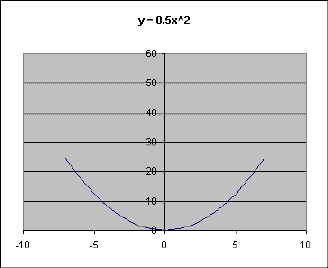
As you can see, when a is larger, the parabola gets narrower, while if a is a fraction (when it gets smaller but not negative), the parabola gets wider.
Working with c also moves the parabola. These graphs use the basic parabola with c changed. On the left, c = 6. On the right, c = -6.
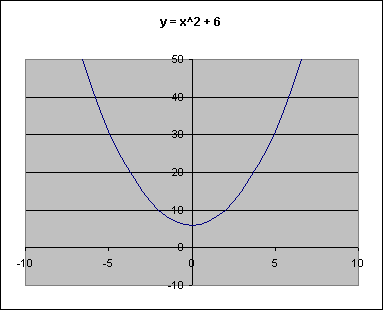
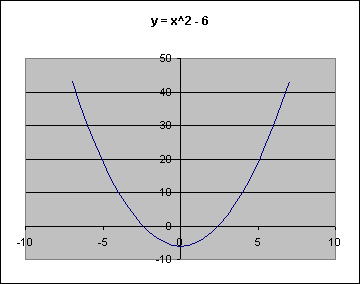
You see that when c was 6, the vertex was moved up 6 from the origin (its place in y = x2), and when c was -6, the vertex was moved 6 down. When b = 0, c moves the vertex up if it is positive and down if it is negative.
When b is not 0, c can not longer be used so simply. As you may know, the formula for the x-coordinate of the vertex is -b/2a. As b changes, this obviously changes. You can then substitute this value of x back into the equation to find the y-coordinate. When b ≠ 0, you must first find the vertex and then sketch the parabola
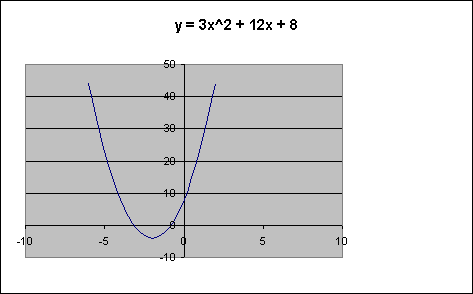
y = 3x2 + 12x + 8
x-coordinate = -12/6 = -2
y = 3(-2)2 + 6(-2) + 8 = 12 - 12 + 8 = 8
vertex = (-2, 8)
First plot the vertex. Then sketch the parabola. Since x = 3, the parabola will be narrower, but not much narrower, than the basic shape. This is what it is:
Click here
to go back to the second page of graphing parabolas.
Click here
to go back to the first page of graphing parabolas.
Click here to go back
to the index.