Graphing Linear Equations
Well now, come this far? Cool. To graph linear equations, we remember that they will always make a straight line (hence the term "linear"). Usually these equations have 2 variables, x and y, for the two axes, but sometimes can have only one. Before we go into all this though...dum dum dum dum!!!! Vocabulary!!
Graph: a picture of the solutions of an equation
**Can be called x-y axis, coordinate plane, or Cartesian Coordinate Plane/System**
Abscissa: number of the x-axis
Ordinate: number of the y-axis
Origin: point where the x-axis and y-axis meet (0,0)
Ordered Pair: (x, y) give the coordinates of a point, called ordered pair because the coordinates are in alphabetical order, x, then y
x-axis: horizontal axis
y-axis: vertical axis
One a graph, to the left and down from the origin, the numbers are negative. I will assume you know how to plot points. If you don't, I will ask that you learn, then come back. But right now, we're not going to graph. We are going to figure out ordered pairs for linear equations.
Take the equation x + y = 4.
Now, this is a linear equation, just with two variables. Because we have two variables but only one equation, the variables can have infinitely many solutions. Now what I usually do to find ordered pairs (a value of x and a value of y that will make the equations true at the same time) is to first get a variable alone on one side. If I got y alone on one side, then I would be solving for y in terms of x.
So to do that in x + y = 4, we subtract one variable from each side...
x + y = 4
-x -x
y = 4 - x
(Standard form is putting the variable first - it would be y = -x + 4, but that is not necessary here.)
Now we have solved for y in terms of x (getting x alone on one
side is fine - it would be solving for x in terms of y).
So....we make a TABLE OF VALUES: list of solutions
to an equation
It looks like this:
x | y
0 | 4
3 | 1
1 | 3
-1 | 5
These are some solutions. You technically only need 2 to make the line, but it is good to have 3 at least.
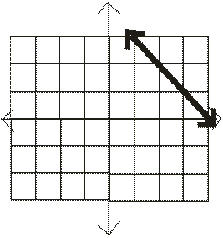
Now we know three points that will be on the line in the graph of this equation are (0,4), (3,1), and (1,3). What you will do, is plot these points, draw a straight line connecting them (put arrows at the end of it to show the solutions go on), and write the equation on/next to the line. Any point on that line will be a solution to the equation x + y = 4. Usually in tables of values, you put in 0, 1, and 2, for the variable not alone on one side. You can put others in if it makes it easier, especially if you have fractions in your equations. The graph for x + y = 4 is shown below (without the equation on it - I can only do so much on a computer).

Click here to go back to the index.